
In This Guide
- 1Why Standard Google Smart Bidding Caps Your Growth
- 2How pLTV Changes the Signal Architecture
- 3The Three Activation Paths into Google Ads
- 4Step-by-Step: Building Your pLTV Signal Pipeline
- 5Configuring tROAS Around Predicted Value
- 6Data Requirements and Model Readiness Checklist
- 7Common Failure Modes and How to Avoid Them
- 8Measuring What Actually Improved
Google's Smart Bidding is a powerful optimization engine. It reads dozens of real-time signals per auction and adjusts your bids in milliseconds. The problem is not the engine. The problem is what most DTC brands feed it as the optimization target.
Standard tROAS bidding tells Google's algorithm to maximize first-order revenue. A customer who spends $80 once and never returns gets the same bid weight as a customer who spends $80 on their first order and $600 over the next 12 months. The algorithm has no way to distinguish them because you have not given it the signal that would let it do so.
Predictive LTV bidding changes the input. Instead of passing Google the first-order revenue event, you pass a predicted 12-month customer value score derived from your own first-party behavioral data. The auction mechanics remain identical. What changes is the value signal powering the bids, and that changes everything downstream.
What This Guide Covers
This is a technical implementation guide. It covers ML signal architecture, the three activation paths into Google Ads, conversion value rules, Customer Match configuration, and tROAS setup. It assumes you have first-party purchase data and are spending at least $30K per month on Google paid acquisition.
Why Standard Google Smart Bidding Caps Your Growth
Google's Smart Bidding uses real-time auction signals including device, location, time of day, and browsing context to predict conversion probability and set bids accordingly. When you use tROAS, the system optimizes for conversion value divided by spend. The constraint is that it can only optimize for the value signal you provide.
For most eCommerce brands, that signal is the transaction value at checkout. This creates a structural ceiling: Google learns to win auctions for people likely to make a purchase of a given size today. It does not learn anything about whether that purchase will be followed by five more, or none.
The downstream consequence compounds over time. As you scale paid acquisition budget, you do not just acquire more customers. You acquire more of every customer type in proportion to how the algorithm has learned to bid. If the algorithm optimizes for first-order checkout value, it gets progressively better at winning auctions for one-time buyers and progressively worse at your actual business objective.
How pLTV Changes the Signal Architecture
A pLTV bidding system replaces the static checkout value with a dynamic, model-generated prediction. The prediction is generated by an ML model trained on your historical cohort data. It maps early behavioral signals to observed long-term revenue outcomes and learns which combinations of features predict high-value customers with statistical confidence.
The model's output is a continuous score, typically expressed as predicted 12-month or 24-month revenue per customer. That score flows into Google's bidding layer as the conversion value, replacing or supplementing the checkout transaction value. Google's algorithm then optimizes bids to maximize predicted long-term value rather than immediate transaction size.
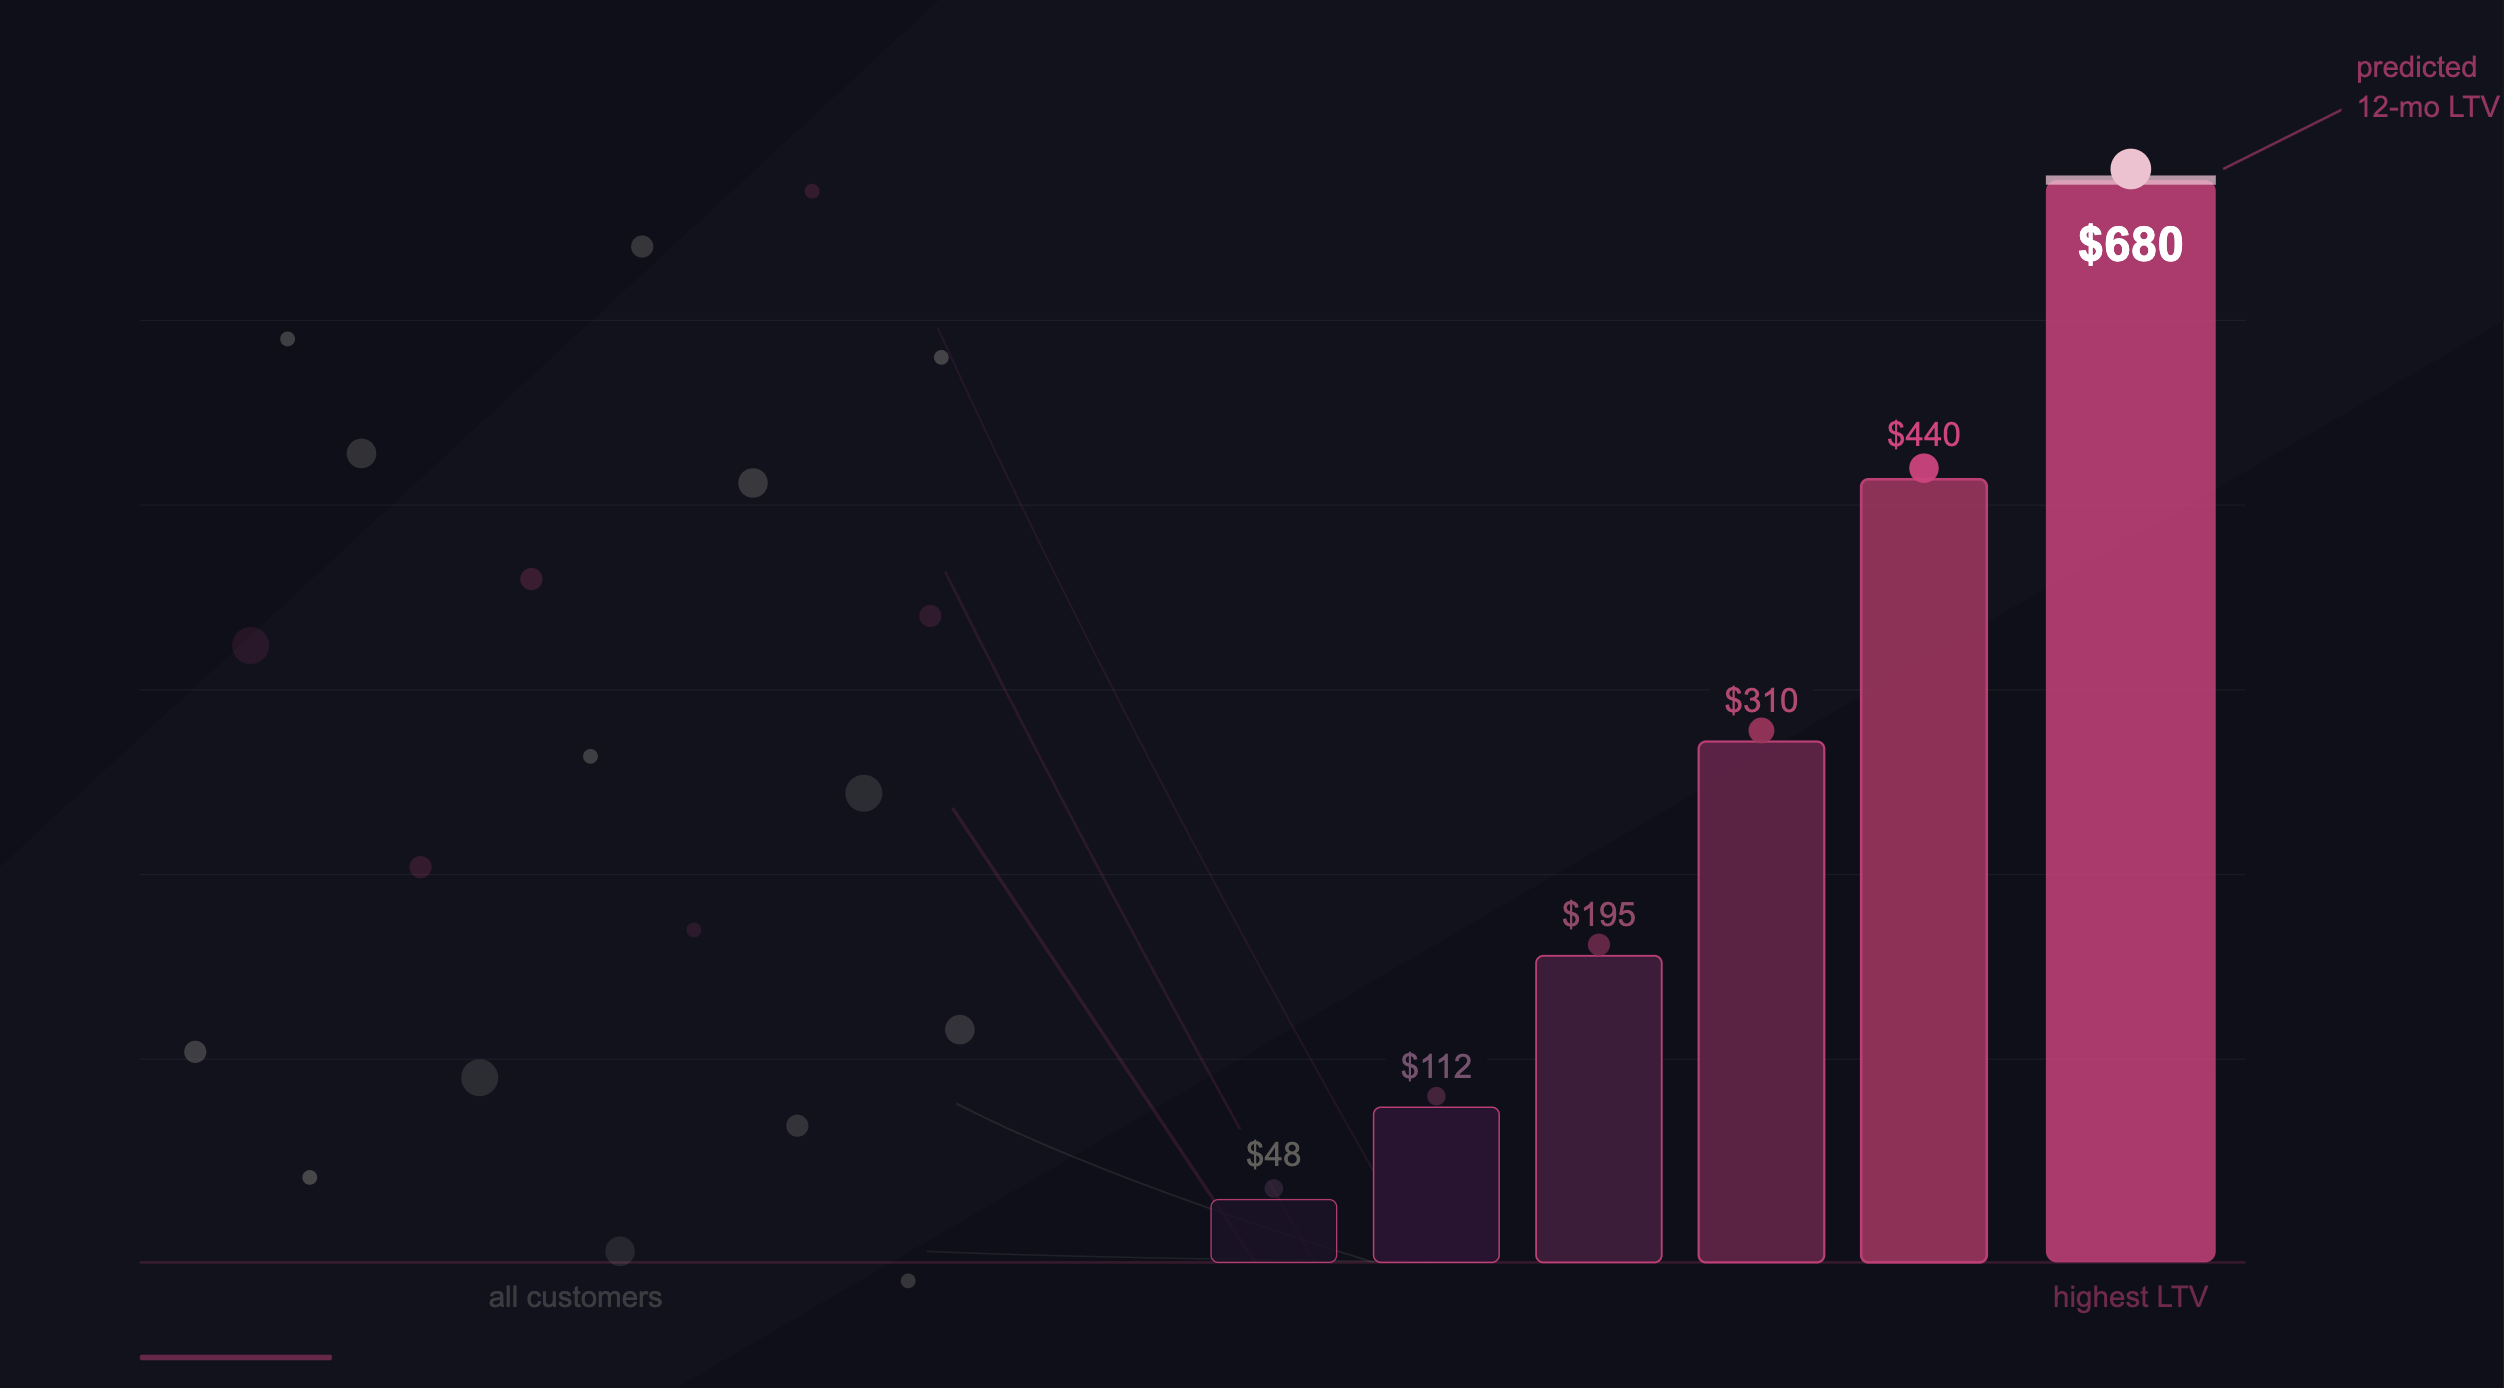
The key technical distinction is that the pLTV score is not a segment or a filter. It is a continuous numeric value that flows directly into the conversion value field of each bid event. Google's auction engine treats it the same way it treats a $84 checkout transaction, except the number is now $412 for a high-value prospect and $31 for a likely one-time buyer. The bidding logic follows the signal.
The Three Activation Paths into Google Ads
There are three ways to get a pLTV signal into Google's bidding layer, each with different latency, fidelity, and infrastructure requirements. Understanding the tradeoffs is important before building your pipeline.
Path 1 (Conversion Value Rules) is the fastest to implement and works within the Google Ads UI without custom engineering. You define multipliers based on audience segments: a Customer Match list of predicted high-value customers receives a 3x multiplier on their checkout transaction value, while a predicted low-value segment receives no multiplier or a reduction. Google's tROAS documentation covers how the system handles these modified values in Smart Bidding.
Path 2 (Customer Match with bid modifiers) uses Google Customer Match to upload segmented customer lists stratified by pLTV tier. You apply bid adjustments per tier directly in campaign settings. The key limitation is the 24-48 hour upload lag: a customer scored today is not in the bidding layer until tomorrow. For fast-moving DTC brands with high daily acquisition volumes, this lag degrades signal quality.
Path 3 (Real-Time Conversion Value API) uses Google's Offline Conversion Import API or Enhanced Conversions to push the pLTV score directly as the conversion value for each event, in sub-second latency. The Google Click ID (GCLID) bridges the click event to the scored conversion value. This is the highest-fidelity implementation and requires a real-time scoring pipeline connected to your ad stack.
Step-by-Step: Building Your pLTV Signal Pipeline
The pipeline has five stages. Each stage has a clear output that gates the next. Do not skip stages or run them in parallel before the upstream output is validated.
Unify and validate your first-party data
Pull purchase history, acquisition channel, behavioral events (page views, category visits, email opens, cart actions), and customer identifiers (email, phone, customer ID) into a single unified table. This is typically built in your data warehouse (BigQuery, Snowflake, Redshift). Validate completeness: you need at least 12 months of purchase history and a minimum of 5,000 customer records with observed 90-day outcomes before model training is meaningful. Missing acquisition channel attribution and missing second-purchase timestamps are the two most common data quality gaps at this stage.
Engineer your predictive features
Transform raw events into model features. The most predictive early signals, based on observed patterns across DTC cohorts, are: days-to-second-purchase (continuous), product category breadth in first 60 days (integer count), AOV direction from order 1 to order 2 (positive or negative delta), lifecycle email click rate before second purchase (rate 0-1), and acquisition channel (categorical, encoded). Feature engineering at this stage is where most of the predictive power lives. A gradient boosting model trained on well-engineered features will outperform a deep neural network trained on raw events by a significant margin, with a fraction of the compute cost.
Train and validate your pLTV model
Train on historical cohorts where 12-month revenue outcomes are already observed. Use a temporal train/test split, not a random split: train on cohorts acquired before a cutoff date, test on cohorts acquired after. Random splitting causes data leakage from future behavioral signals into the training set and produces inflated validation metrics that do not reflect production performance. Evaluate using mean absolute error (MAE) and Spearman rank correlation. You want the model to rank customers correctly relative to each other more than you want precise absolute value predictions. A model with high rank correlation but moderate MAE will outperform in practice.
Generate pLTV scores and build audience tiers
Run inference on your current active customer base and all new customers as they enter. Segment scores into tiers: top 20% by predicted LTV (high value), middle 50% (mid value), and bottom 30% (low value or one-time-buyer profile). These tiers map directly to Customer Match lists and conversion value multipliers. Refresh scores continuously or at minimum daily for the top tier, weekly for mid and low tiers.
Activate into Google Ads
Upload Customer Match lists per tier following Google's hashing requirements (SHA256 for email, phone, name). Set bid modifiers by tier in your campaigns. Configure conversion value rules to apply the pLTV multiplier to checkout events from each tier. If implementing Path 3, configure your Enhanced Conversions pipeline to pass the pLTV score as the conversion value via the Google Ads API for each new-customer acquisition event.
Customer Match Data Requirements
Google requires SHA256-hashed email, phone, and address data before upload. Lists must have at least 100 matched members and must be refreshed at least every 540 days to remain active. Per Google's Customer Match policy, you can only upload first-party data you collected directly. Purchased lists are prohibited. See Google's official Customer Match best practices for full formatting requirements.
Configuring tROAS Around Predicted Value
Once your pLTV scores are flowing into Google's bidding layer as conversion values, your tROAS target needs to be recalibrated. A 400% tROAS on first-order checkout revenue means something fundamentally different from a 400% tROAS on predicted 12-month customer value. The denominator is the same (ad spend), but the numerator has changed from $84 to $412.
The practical recalibration: if your historical first-order ROAS was 400% and your average pLTV score is 4.9x your average first-order transaction value, your equivalent pLTV-based tROAS target is approximately 400% divided by 4.9, or roughly 82%. You are now telling Google to optimize for $0.82 return for every $1 spent, where that $0.82 represents your predicted 12-month customer LTV, not the immediate transaction. Per Google's tROAS documentation, the algorithm will respect this target and scale volume accordingly.
Start Your tROAS 20% Below Historical
When switching conversion value inputs, set your initial tROAS 20% below your recalibrated target. Google's algorithm needs a learning period of 3-4 weeks and at least 30 conversions to stabilize. Setting an aggressive tROAS target immediately chokes volume before the model has enough data to optimize effectively. Optmyzr's research on value-based bidding confirms that gradual ramp-up significantly outperforms hard targets at launch.
Data Requirements and Model Readiness Checklist
The most common reason pLTV implementations underperform or fail is insufficient data quality upstream of the model, not a problem with the bidding configuration. Before investing in Google Ads API integration, validate each of the following.
Minimum 12 months of purchase history
You need observed 12-month revenue outcomes for historical cohorts to train a 12-month LTV model. If your brand is under 18 months old, build a 90-day LTV model first and expand the horizon as cohort data matures. Training on 3-month outcomes and extrapolating to 12-month predictions without validation produces unreliable scores.
At least 5,000 customers with observed outcomes
A gradient boosting model needs sufficient examples across the value distribution to learn meaningful feature relationships. Under 5,000 customers, the model will overfit to noise, particularly at the tails of the distribution (your highest and lowest LTV customers), which is exactly where accurate prediction matters most.
Acquisition channel attribution at the customer level
Acquisition channel is one of the five strongest predictors of long-term customer value. If your attribution data does not reliably connect each customer to their originating channel (paid search, organic, paid social, email), this feature cannot be used and model accuracy degrades. Fix attribution before building the model.
Email or phone match keys for Customer Match
Google Customer Match requires hashed email or phone numbers. Match rates typically range from 30-70% depending on data quality. Per Google's own data, uploading two match keys (email plus phone) increases match rates by 28% on average. Three keys (email, phone, address) raises it by 35%. Low match rates are the most common operational failure in Customer Match-based pLTV activation.
A continuous retraining schedule
A model trained once and deployed indefinitely is a liability. Customer behavior shifts seasonally and by product evolution. Research on model drift in eCommerce contexts shows that a model trained on Q1 cohort data loses meaningful predictive accuracy within 60-90 days as purchase patterns shift. Build a retraining schedule into the pipeline architecture from the start, not as an afterthought.
Common Failure Modes and How to Avoid Them
Most pLTV implementations that fail do so for one of three reasons. Understanding the failure modes before building saves significant rework.
The most insidious failure is mixing conversion value types within a single campaign. If some events send pLTV scores as the conversion value and others send first-order checkout values, Google's algorithm receives contradictory signals and cannot build a coherent bidding model. Optmyzr's value-based bidding research identifies this as the most common cause of unexplained performance degradation after a pLTV system launch.
Measuring What Actually Improved
The correct measurement framework for a pLTV bidding system is not ROAS. ROAS is a downstream output of the bidding signal you choose. The primary metrics are the ones that tell you whether the signal itself is working.
| Metric | What It Measures | Target Direction | Measurement Window |
|---|---|---|---|
| 90-day revenue per acquired customer | Whether pLTV bidding is selecting higher-value customers | Up vs. pre-pLTV baseline cohort | Compare 90-day cohorts, 60 days post-launch |
| LTV:CAC ratio by acquisition channel | Whether pLTV signal is improving spend efficiency per channel | Up, especially in paid search | 90-day lookback, updated monthly |
| Model rank correlation (Spearman) | Whether pLTV scores correctly rank customers by actual outcome | Above 0.6 for a working model | Monthly validation against 90-day outcomes |
| Customer Match match rate | Whether your audience lists are large enough to influence bidding | Above 40% for meaningful signal | After each upload cycle |
| % new customers from predicted top-tier | Whether the algorithm is acquiring more high-value profiles | Up vs. pre-pLTV baseline | Cohort comparison, 60-90 days post-launch |
| tROAS (conventional) | Lagging indicator of overall system performance | Stable or up (not primary metric) | Weekly, with 30-day smoothing |
Run a controlled experiment using Google Ads Campaign Experiments for the first 6-8 weeks. Split traffic 50/50 between your standard tROAS campaigns and your pLTV-signaled campaigns. Measure 90-day revenue per acquired customer across both arms. Do not evaluate the experiment early on ROAS alone since the pLTV-signaled arm may show lower in-platform ROAS initially as it bids more aggressively for expensive high-value customers.
The signal that the system is working is a measurable improvement in 90-day cohort revenue per acquired customer in the pLTV arm, at equivalent or better spend efficiency. That is the number that determines whether you scale the implementation across your full paid search portfolio or return to the model for recalibration.
Key Takeaways
- Standard tROAS optimizes for first-order checkout value. pLTV bidding replaces that signal with predicted 12-month customer value. The auction mechanics are identical. The economics are not.
- There are three activation paths into Google Ads: Conversion Value Rules (low complexity, real-time), Customer Match with bid modifiers (medium complexity, 24-48hr lag), and the Real-Time Conversion Value API (high complexity, sub-second). Start with Path 1 and 2 in parallel.
- Recalibrate your tROAS target after switching conversion value inputs. A 400% tROAS on checkout revenue is a completely different optimization target than 400% tROAS on predicted LTV.
- The three primary failure modes are stale model signals, mixed conversion value types within a campaign, and Customer Match lag misaligned with bidding cycles.
- Measure 90-day revenue per acquired customer and LTV:CAC ratio, not ROAS, as the primary success metrics for a pLTV bidding implementation.
The infrastructure required to do this correctly is not trivial. A unified customer data table, a continuously retrained ML model, a real-time scoring pipeline, and a Google Ads API integration are four separate engineering problems that most growth teams cannot build simultaneously while also running their acquisition programs. That is the gap AdZeta's ValueBid framework closes: the entire pipeline from your data lake to Google's bidding layer, with continuous model retraining and auditable signal output.