
Most growth teams know what a customer spent last month. Very few know what a customer will spend over the next 12 months, before the second purchase happens. That gap is where budget gets wasted, CAC gets distorted, and scaling becomes guesswork.
Predictive Customer Lifetime Value (pLTV) closes that gap. It uses behavioral signals from your first-party data to score incoming customers by their future revenue potential, in real time. The result: your ad stack stops optimizing for clicks and starts optimizing for customers who actually matter.
The Core Problem in One Sentence
At the moment of acquisition, a $500 LTV customer and a $20 LTV customer look identical. Same click. Same CPA on the dashboard. Same bid price from your platform. pLTV changes that.
What Predictive Customer Lifetime Value Actually Means
Customer Lifetime Value (LTV) is the total revenue a customer generates over their relationship with your brand. Most teams calculate this historically, looking backward at what customers have already spent. Predictive LTV (pLTV) flips the direction: it estimates future value at or near the moment of acquisition.
A pLTV model ingests early behavioral signals: browsing patterns, first purchase category, time-to-repurchase, email engagement; and outputs a score that predicts where a new customer will land in your revenue distribution. That score can then be fed directly into your bidding layer on Google, Meta, or programmatic platforms.
This is distinct from simple LTV modeling, customer segmentation after the fact, or lookalike audiences. pLTV is a live, continuously updated prediction, not a static report. The output isn't a segment. It's a bid signal.
Historical LTV vs. Predictive LTV: What's the Actual Difference?
Historical LTV tells you what already happened. You pull cohort data, calculate average revenue per customer at 90, 180, and 365 days, and use those averages to benchmark performance. It's useful for reporting. It is nearly useless for real-time acquisition decisions.
Historical LTV vs. Predictive LTV
| Dimension | Historical LTV | Predictive LTV (pLTV) |
|---|---|---|
| Direction | Backward-looking | Forward-looking |
| When it's calculated | After purchase history exists | At or near moment of acquisition |
| Primary use | Reporting & cohort analysis | Real-time bid signals |
| Updates | Periodic (weekly/monthly) | Continuous |
| Feeds into | Dashboards & attribution tools | Google, Meta, programmatic bidding |
| Value unlocked | Understanding past performance | Improving future acquisition economics |
The practical implication: historical LTV can tell you that your best customers came from organic search 18 months ago. pLTV tells your bidding algorithm, today (in real time), to pay 3x more for the customer profile most likely to become one of those high-value buyers.
Why Traditional Bidding Is Costing You More Than You Think
Most performance marketing teams optimize for ROAS or CPA. Both metrics measure the cost or return of a single transaction. Neither tells you anything about whether that transaction turned into a profitable customer relationship. A 6x ROAS on a product with a 2% repeat rate and a 30-day payback window is a burning building, it just looks good on the dashboard.
The problem compounds at scale. As you grow your paid acquisition budget, you don't just acquire more customers — you acquire more of every customer type, including your least profitable profiles. Without pLTV-based filtering in your bidding, increased spend often means a worse LTV:CAC ratio over time, not a better one.
How pLTV Models Actually Work
A pLTV model is a machine learning system trained on your historical customer data to predict future revenue. The inputs are behavioral signals observed early in a customer's lifecycle — or sometimes before the first purchase. The output is a score, often expressed as predicted 12-month or 24-month revenue.
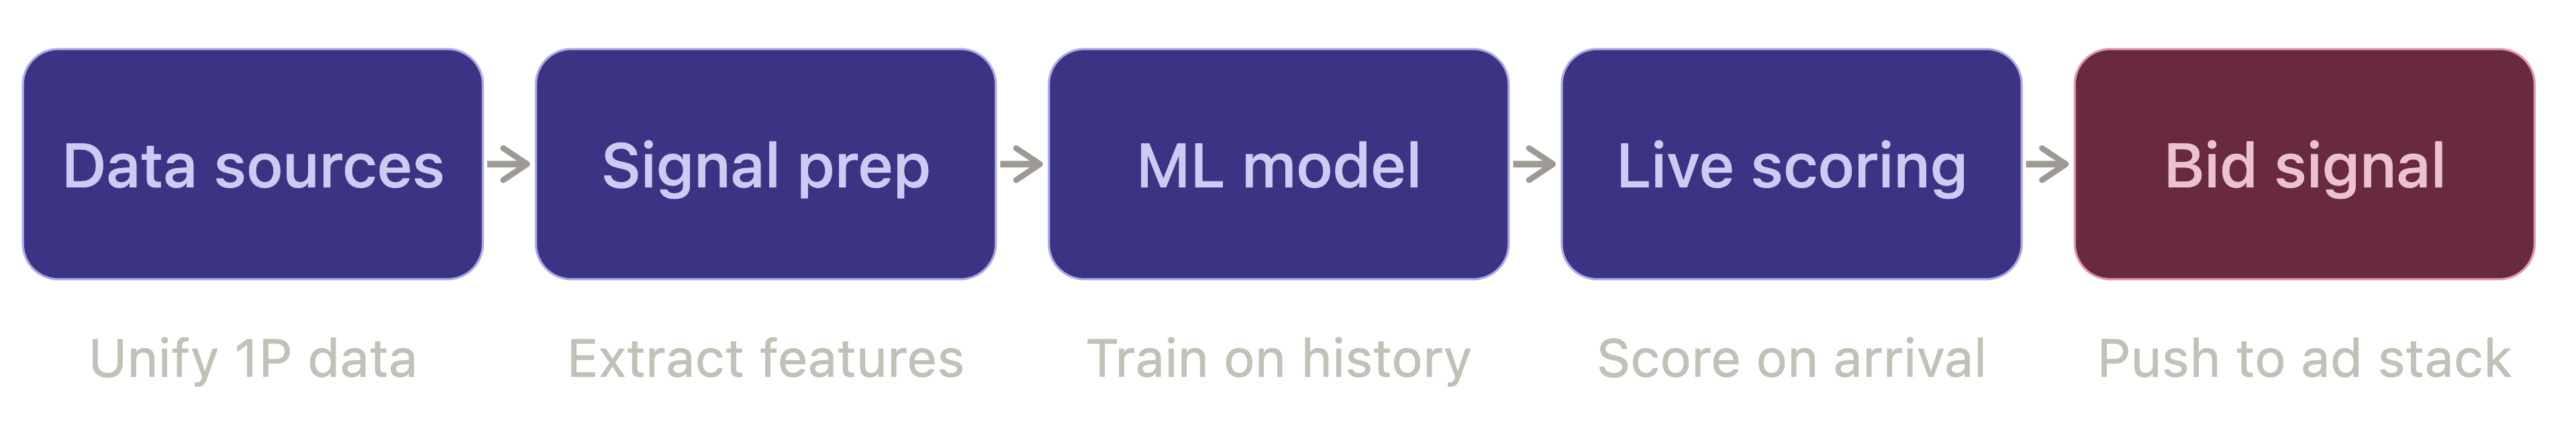
Data Unification
First-party data from your data lake, CRM, ecommerce platform, and ad stack is unified into a single customer view. Purchase history, engagement signals, acquisition source, and behavioral events all feed into the model.
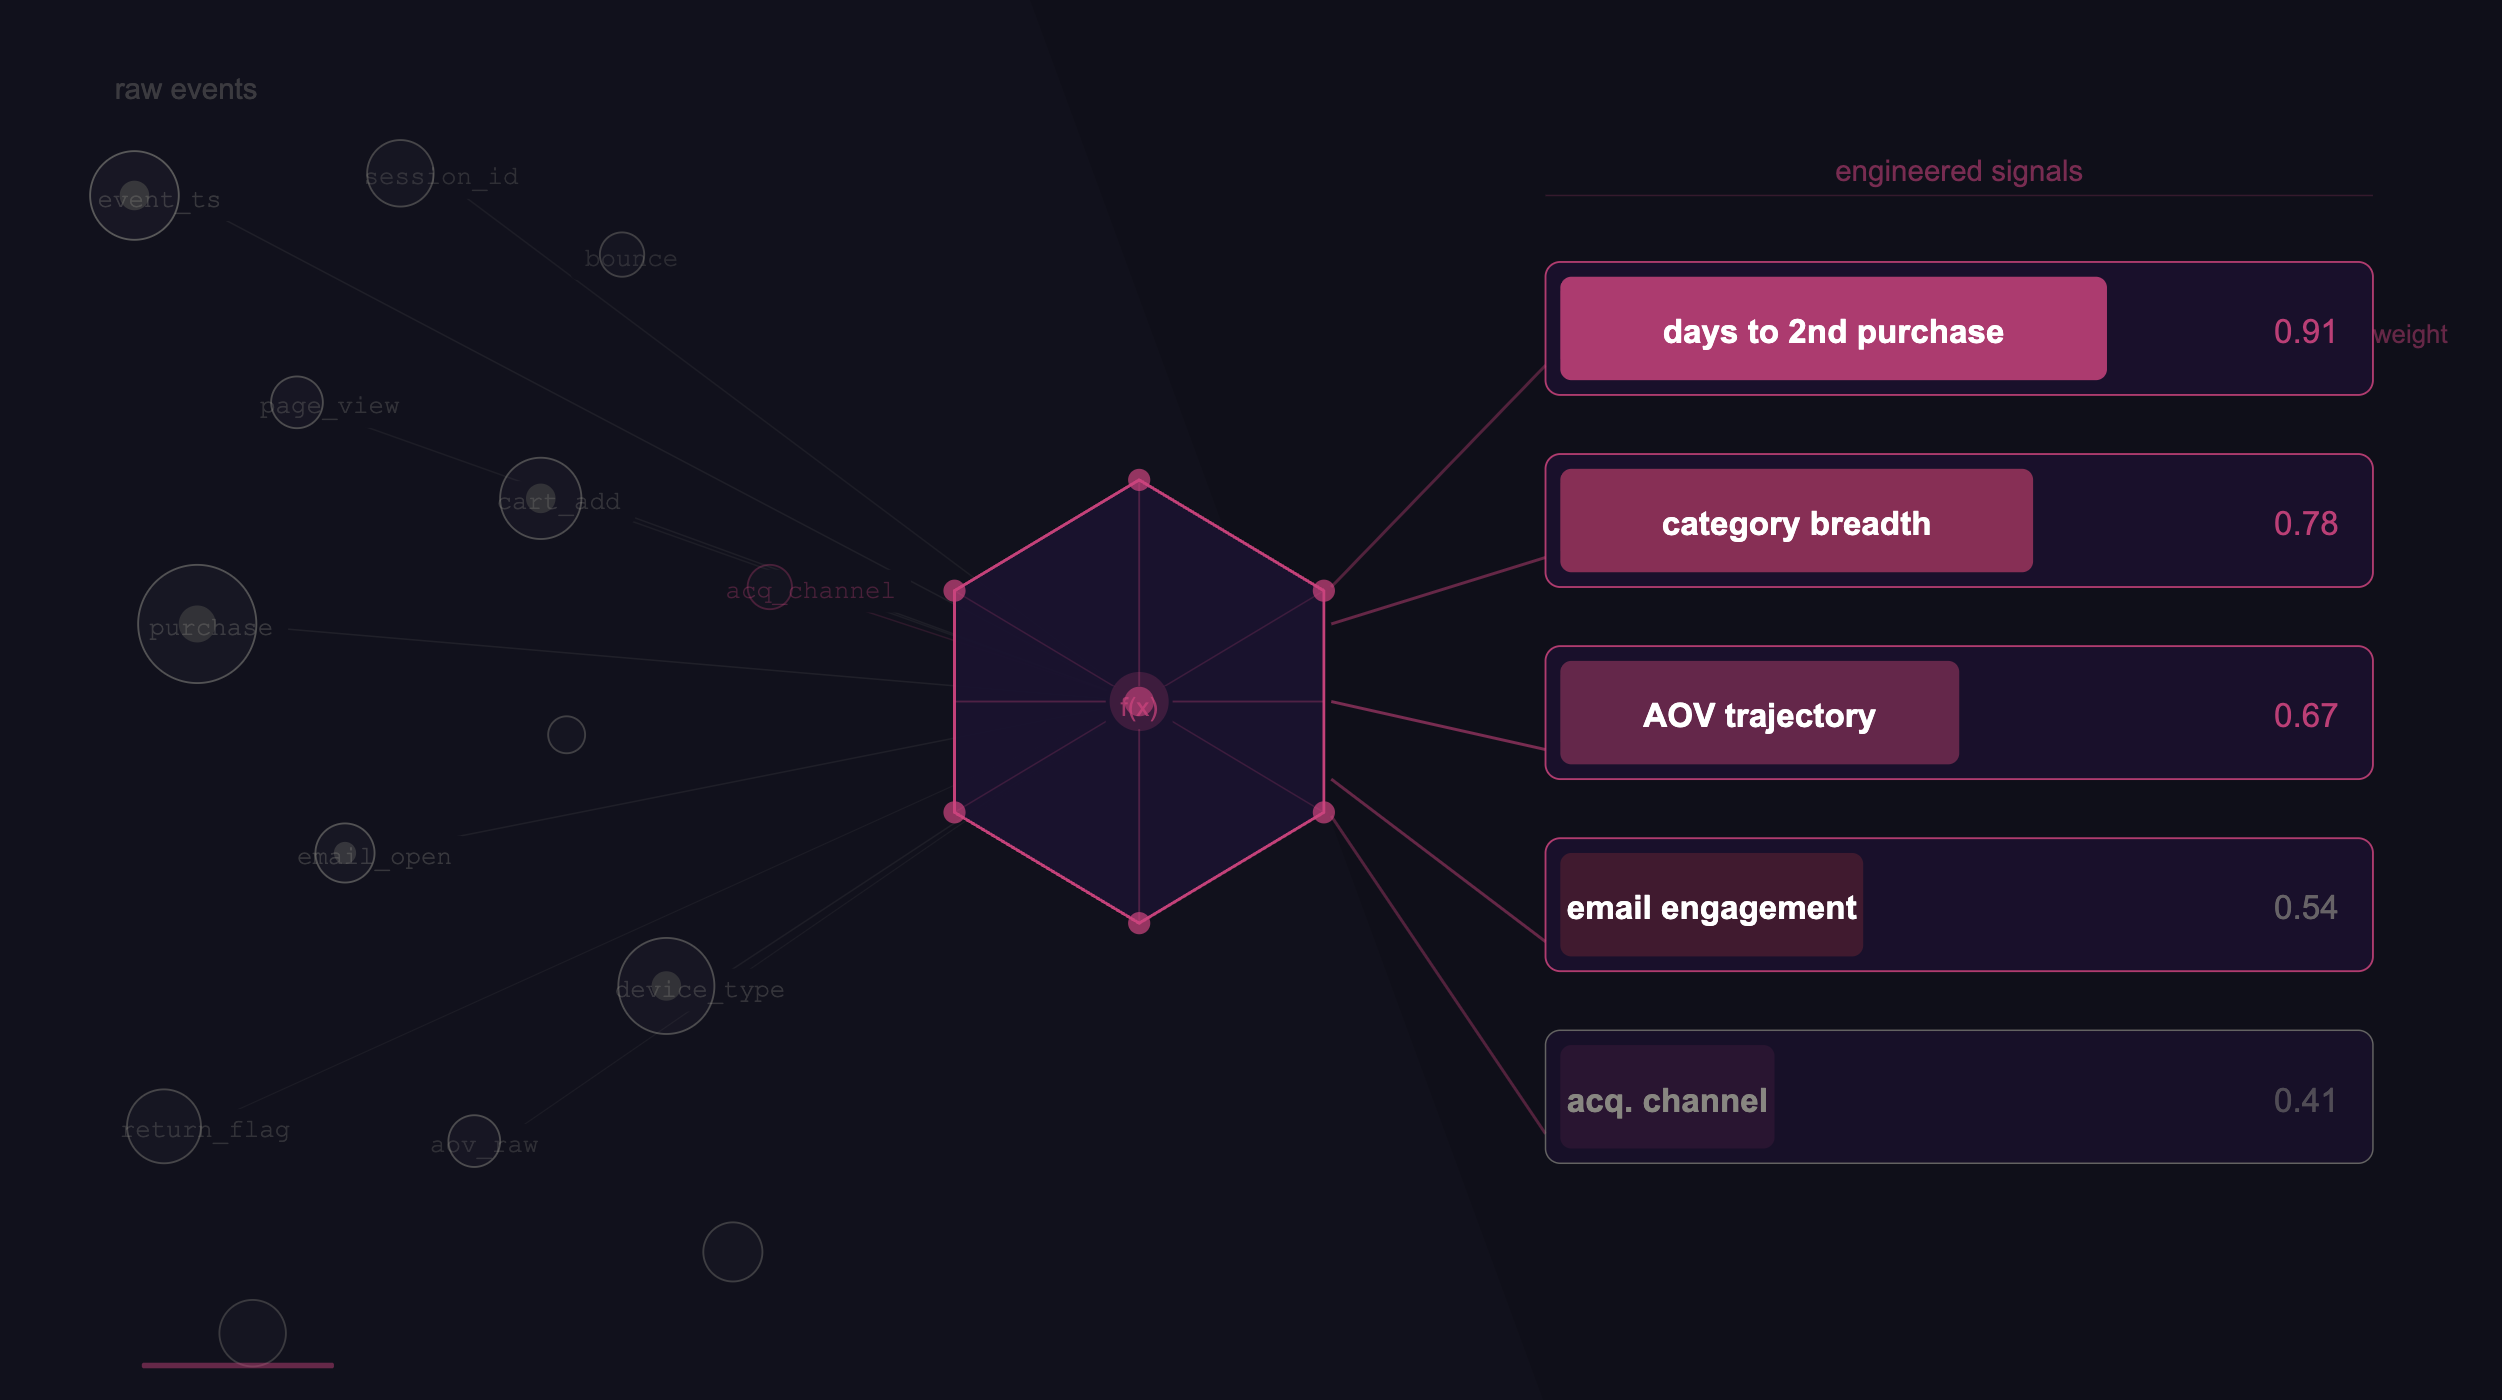
Feature Engineering
Raw data is transformed into predictive features — time-to-second-purchase, category breadth, AOV trajectory, email engagement rate. These features are what the model actually learns from, not the raw transactions.
Model Training
A supervised ML model (typically gradient boosting or a neural network) trains on historical cohorts where the LTV outcome is already known. It learns which early signals correlate with high long-term value.
Real-Time Scoring
When a new customer enters your ecosystem, the model scores them immediately against the trained feature set. This score updates as new behavioral signals arrive — a second page view, an email open, a cart add.
Bid Signal Activation
The pLTV score is translated into a bid modifier and pushed directly to your ad platforms via API — Google Customer Match, Meta Conversions API, or programmatic DSPs. High-scoring profiles get higher bids. Low-scoring profiles get pulled back or excluded.
The critical step most solutions miss is Step 5 real-time activation. Many teams build solid pLTV models that live in a warehouse and get exported to a CSV once a week. The model runs in one system. The signal sits in a file. Someone uploads it manually. By the time that signal reaches the bidding layer, it's already stale.
The Handoff Problem
A pLTV model is only as valuable as the speed at which its scores reach your bidding layer. Warehouse → CSV → manual upload → ad platform is a broken pipeline. Real-time API activation is what separates a working pLTV system from an expensive reporting exercise.
The Five Signals That Predict High-Value Customers
After analyzing data across 50+ DTC brands, consistent patterns emerge in the signals that predict high long-term customer value. None of these are exotic. They exist in most brands' first-party data today. They're just not being fed into the bidding layer.
Time to Second Purchase
The single strongest predictor of LTV. Customers who repurchase within 30 days show 3x the 12-month LTV of those who don't. Most brands track repurchase rate, tracking speed-to-repurchase is a fundamentally different and more predictive signal.
Category Breadth in First 60 Days
Customers who buy across more than one product category early are significantly more likely to stay. Single-category buyers churn. Multi-category buyers explore, and that exploration is measurable before the data fully matures.
AOV Direction (Not Amount)
It's not the absolute order value that matters, it's the direction. Customers whose average order value increases from purchase one to purchase two show dramatically higher predicted LTV than those who drop or stay flat.
Lifecycle Email Engagement Before Second Purchase
Open rates and click-through on product recommendation emails signal purchase intent before a second transaction exists to measure. This pre-transaction engagement is a high-quality leading indicator for retention.
Channel of First Acquisition
The channel that brings a customer in has predictive power on behavior for up to 24 months, not just the first purchase. Paid social and organic search customers don't just look different at acquisition; they behave differently at month 18.
pLTV in Action: From Data Lake to Ad Stack
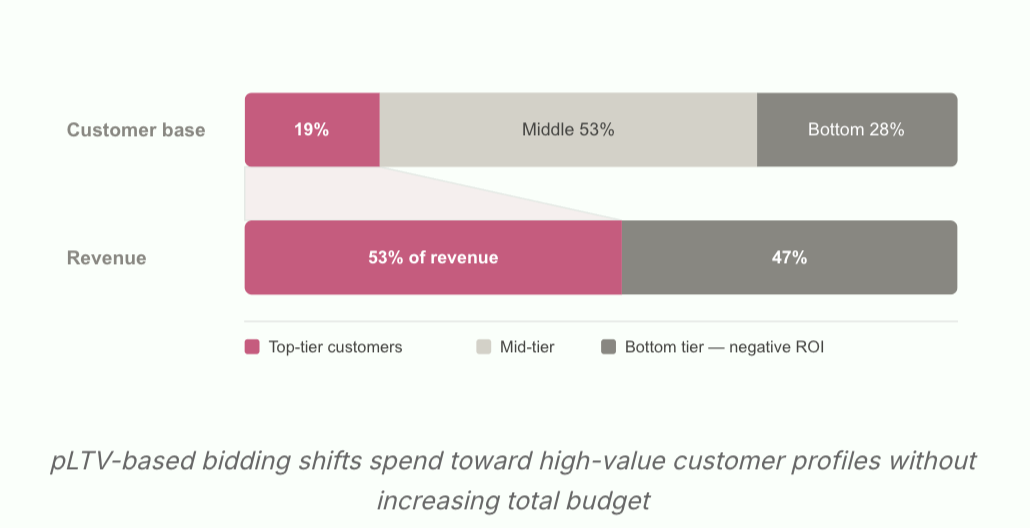
Here's a concrete example of how pLTV changes acquisition economics. A DTC brand spends $80K per month on paid acquisition. A revenue concentration analysis shows their top 19% of customers by LTV generate 53% of total revenue. Their bottom 28% cost more to acquire than they ever return.
With a working pLTV model, that brand restructures bidding around predicted customer value. Higher bids (sometimes 2–4x the baseline) for incoming prospects that match the top-tier behavioral profile. Reduced or excluded bids for profiles that consistently generate single-purchase churners. Total budget stays flat.
The outcome isn't just better ROAS on a dashboard. It's a structurally different customer base: higher 12-month revenue per acquired customer, lower effective CAC, and a compounding LTV:CAC ratio that makes each subsequent month of acquisition cheaper in real terms.
pLTV vs. Lookalike Audiences: Why They're Not the Same Thing
Lookalike audiences are often positioned as an LTV strategy. They are not. With lookalikes, you show the platform your best customers and it finds people who look similar. The platform decides which signals matter. You have zero visibility into what it's actually optimizing for.
With pLTV bidding, your model scores each incoming prospect using your first-party behavioral signals and bids proportionally. You control the signal. You can see exactly why you paid $45 for customer A and $12 for customer B. One is a black box that might be working. The other is an auditable system.
Key Takeaways
- Lookalike audiences are platform-controlled signals: You have no visibility into what the algorithm actually uses to match.
- pLTV bidding uses your own first-party model: Every bid decision is explainable and auditable.
- Lookalikes optimize for profile similarity. pLTV optimizes for predicted future revenue, these are different objectives that produce different customer cohorts.
- pLTV signals can be layered on top of lookalike audiences, but they cannot be replaced by them.
Is Your Growth Team Ready for pLTV?
pLTV requires three things working simultaneously: clean first-party data, a model that updates in real time, and a bid signal that connects directly to your ad stack without losing fidelity in the handoff. Most teams have pieces of this. Few have all three integrated.
First-Party Data Foundation
You need unified customer data that includes purchase history, behavioral events, and engagement signals, ideally stored in a data warehouse or CDP. Cookie-based or third-party data won't power a reliable pLTV model in the current signal environment.
Continuous Model Retraining
A model trained once and deployed indefinitely is a liability. Customer behavior changes seasonally, by channel mix, and by product evolution. A production pLTV system retrain on fresh cohort data continuously, not quarterly.
Real-Time Bid Activation
The pLTV score needs to reach your bidding layer within seconds, not days. This means direct API integration with Google Customer Match, Meta CAPI, or your DSP, not CSV exports, not manual uploads.
If you're spending more than $50K per month on paid acquisition and haven't run a revenue concentration analysis on your customer base, you're bidding blind. The data already exists in your warehouse. The signals are already there. They're just not being used.
The Bottom Line
Predictive LTV is not a reporting upgrade. It is a fundamental shift in how acquisition economics work. When your bidding layer knows which incoming customers are likely to generate 10x the revenue of others — and can act on that prediction in real time — your entire paid acquisition program operates on different math.
ROAS becomes a lagging indicator of a well-tuned pLTV system, not the primary objective. CAC drops — not because you spend less, but because the dollars you spend pull in better customers. LTV:CAC improves every month as the model learns and the signal quality compounds.
The brands that scale profitably in 2026 won't be the ones with the biggest ad budgets. They'll be the ones who figured out which customers were worth winning — before the purchase history existed to tell them.
Key Takeaways
- pLTV predicts future customer revenue at or near the moment of acquisition, before purchase history exists to measure it.
- The core problem: at acquisition, a $500 LTV customer and a $20 LTV customer look identical to your ad platform. pLTV changes that.
- 15–40% of paid acquisition budgets at most DTC brands fund customers who never return. pLTV-based bidding recovers that spend.
- Real-time activation is the make-or-break step. A pLTV model sitting in a warehouse and exported to CSV weekly is not a working system.
- The five strongest early predictors: time to second purchase, category breadth, AOV direction, email engagement before repurchase, and acquisition channel.