
In This Article
- 1What CAC Actually Measures (and What It Misses)
- 2The 222% Problem
- 3Why a Falling LTV:CAC Ratio Is the Real Crisis
- 4The Real-Time Activation Problem
- 5How pLTV Converts LTV:CAC From Lagging Indicator to Bidding Signal
- 6Building a CAC Framework That Accounts for Customer Quality
- 7What Good LTV:CAC Looks Like in Practice
- 8Related Reading
Your CAC dashboard shows $68 per acquired customer. That number went up 24% this year. Your team is working on ways to bring it down. None of that tells you whether $68 is a good price. The question that determines whether you should scale, pull back, or reallocate budget is not "how much does a customer cost" but "how much is that customer worth over the next 12 months." Those are different questions and most DTC brands are only measuring the first one.
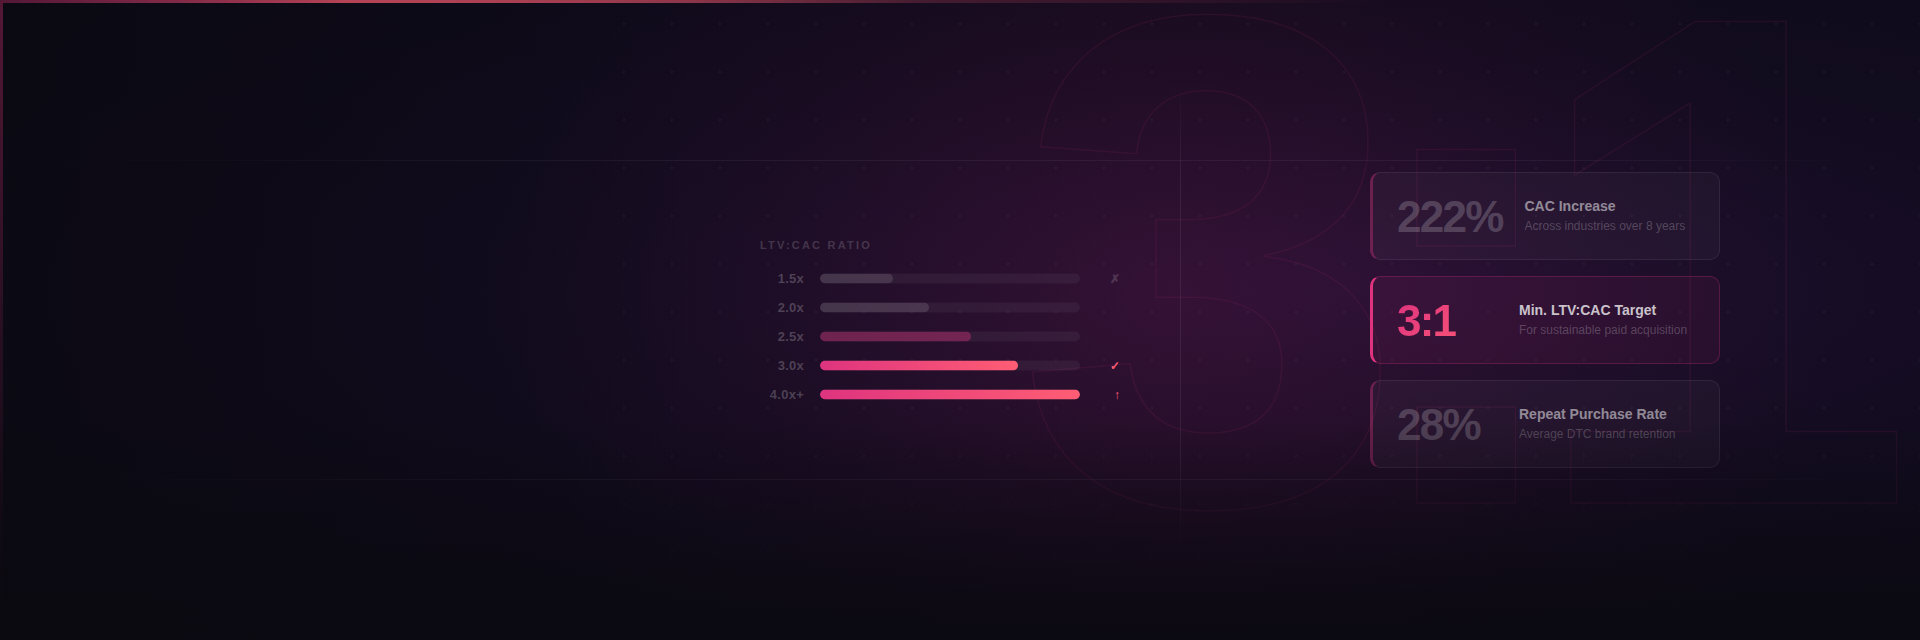
Customer acquisition costs have risen 222% over eight years across industries. Digital-first DTC brands saw a 24.7% single-year jump in 2025 alone, driven by inflating CPMs, iOS signal loss, and an increasingly competitive ad auction. Every performance marketing lead in DTC knows this. What fewer track is that LTV:CAC ratios are compressing simultaneously, meaning the value delivered per acquisition dollar is declining even faster than the cost per acquisition is rising.
A brand where CAC is $68 and 12-month LTV is $136 has a 2.0x LTV:CAC ratio. A brand where CAC is $52 but LTV is $83 has a 1.6x ratio. The second brand is cheaper to acquire customers for and fundamentally worse at it. CAC alone cannot tell you which of these you are running.
What CAC Actually Measures (and What It Misses)
CAC is a cost efficiency metric. It measures the average spend required to convert a prospect into a customer across a defined period. The formula is total acquisition spend divided by number of new customers. That is all it measures. It says nothing about the revenue, retention behavior, repurchase frequency, or churn probability of those customers.
A campaign that acquires 500 customers at $68 each could be generating a cohort of mostly one-time buyers, or a cohort of customers who repurchase every 45 days for three years. First Page Sage's eCommerce benchmarks recommend a CAC:LTV ratio of approximately 3:1 as a healthy target. That ratio requires knowing LTV, which requires measuring what happens after the acquisition. Most attribution and optimization workflows stop at the conversion event.
The 222% Problem
CAC has increased 222% over the past eight years across industries, with digital-first DTC brands experiencing a 24.7% year-over-year rise in 2025 specifically. Meta's Q1 2025 CPM hit an all-time high of $10.88, up 19.2% year-over-year based on benchmarking across 6,000 companies. Google Shopping CPCs jumped 33.72% in 2025. Beauty and personal care saw the steepest CPC climb at 60.11%.
These cost increases would be manageable if customer quality were holding constant. The evidence suggests it is not. The average DTC brand retains just 28.2% of customers for a second purchase. That means 71.8% of acquired customers generate one transaction and disappear. When CPMs rise and retention rates stay low, the compounding effect on contribution margin is not linear. It accelerates.
The brands that survived the CAC inflation cycle of 2021-2025 without margin collapse share a common characteristic: they were measuring LTV:CAC, not CAC in isolation. Profitwell's benchmarking data from 14,800 companies found that companies with mature first-party data ecosystems reported 34% lower average CAC compared to peers relying on third-party cookie-based targeting. The operational advantage of knowing which customers are worth acquiring goes beyond better bidding. It changes which channels you invest in, which creatives you scale, and which cohorts you treat as acquisition targets versus waste.
Why a Falling LTV:CAC Ratio Is the Real Crisis
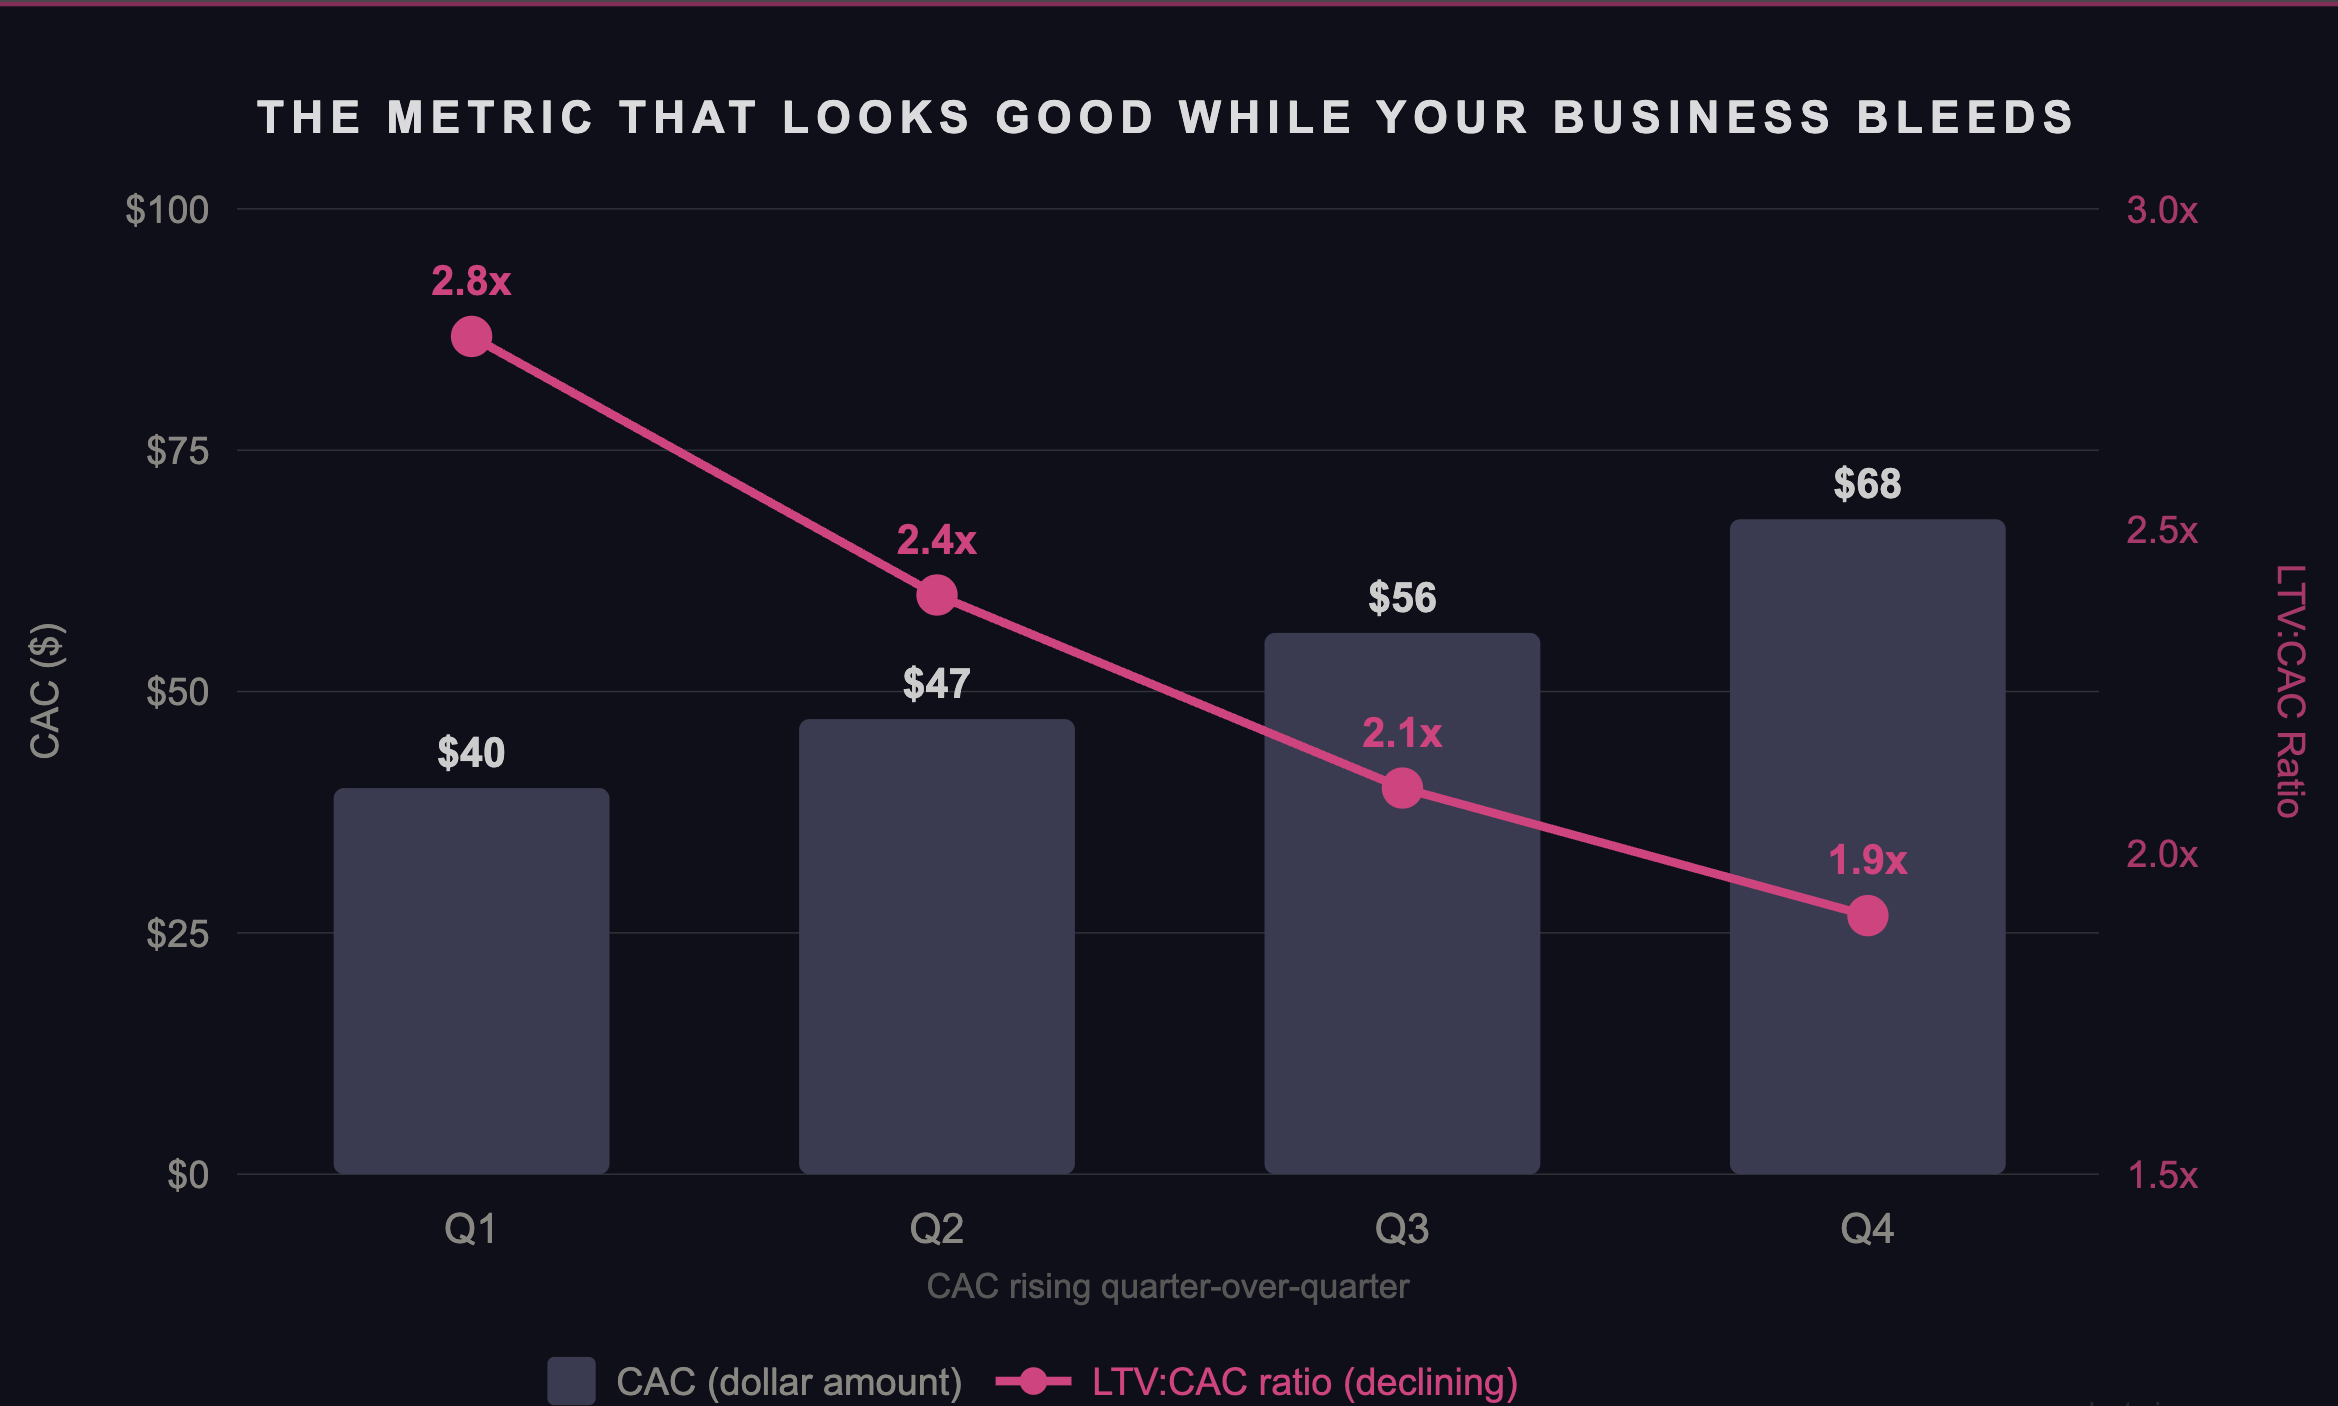
The scenario most growth teams are actually living through is not simply rising CAC. It is rising CAC alongside falling LTV:CAC. CAC goes from $40 to $68 over four quarters, which is visible and alarming. LTV:CAC goes from 2.8x to 1.9x over the same period, which may not appear anywhere in a weekly performance review. The second trend is worse. It means each new acquisition dollar is buying less future revenue, not just costing more.
A 1.9x LTV:CAC ratio is not a growth business. At most contribution margin structures in DTC, LTV:CAC needs to be above 3.0x to support sustainable paid acquisition. At 1.9x, you are buying customers who will not generate enough revenue to cover acquisition cost, operational costs, and contribution margin. The business looks like it is growing while the unit economics confirm it is not.
The Real-Time Activation Problem
Even when growth teams recognize the LTV:CAC framing, the standard workflow breaks down at the activation step. LTV analysis is done retrospectively. A cohort of customers acquired in Q1 has its 90-day LTV calculated in Q2. Those insights inform strategy for Q3. By the time the LTV data is actionable, three months of acquisition have run on the old signal.
This is the gap that real-time LTV activation closes. Rather than waiting for actual 90-day revenue to accumulate before making bidding decisions, a predictive LTV model scores each incoming customer on their likely 12-month value based on early behavioral signals, and that score flows directly into the bidding layer in real time. The relevant signals, which include days to second purchase, product category breadth, AOV trajectory, and email engagement rate before repurchase, are available within the first 7 days of a customer's relationship with your brand. AdZeta's model reaches 85% or higher prediction accuracy by day 7 without waiting for a second purchase.
Why Real-Time Matters
A pLTV model that generates scores weekly and uploads them to your ad platforms via CSV is not a real-time system. By the time the score reaches the bidding layer, the customer has already been acquired at the wrong bid price. The operational advantage of pLTV only materializes when the score influences the bid before the acquisition happens, not after.
How pLTV Converts LTV:CAC From Lagging Indicator to Bidding Signal
Standard tROAS bidding on Google and value optimization on Meta both treat LTV:CAC as a downstream measurement. The algorithm bids, the acquisition happens, and then the brand measures whether the resulting cohort produced a satisfactory LTV:CAC ratio. The causal direction is wrong. pLTV bidding reverses it.
With a pLTV system connected to your ad stack via Google's Offline Conversion Import API or Meta's Conversions API, the predicted LTV score becomes the conversion value the algorithm optimizes for. Instead of optimizing for the cheapest acquisition of any customer, the algorithm learns to find the acquisition profile associated with high predicted 12-month revenue. LTV:CAC stops being a metric you measure at the end of a quarter. It becomes the objective function the algorithm operates against in real time.
Building a CAC Framework That Accounts for Customer Quality
The operational fix starts with reporting structure, not technology. Before any model is trained, HubSpot's customer acquisition benchmarking research consistently shows that brands reporting LTV alongside CAC make structurally different allocation decisions than those reporting CAC alone. The act of tracking the ratio changes behavior. Teams start asking which channels produce a sustainable LTV:CAC, not just which channels produce a low CAC.
Segment your existing customer base by 90-day revenue outcomes
Pull cohorts from the last 12 months and measure what share of acquired customers generated zero second-purchase revenue within 90 days. This number is the baseline cost of your current signal quality. At most DTC brands it sits between 30 and 40%. This is the number pLTV bidding is designed to reduce.
Calculate LTV:CAC by acquisition channel, not blended
Blended LTV:CAC masks the variance between channels. Google Shopping, Meta prospecting, organic search, and influencer-driven traffic all produce different customer quality profiles. A brand with a blended 2.4x LTV:CAC may have a 3.8x ratio from organic and a 1.6x ratio from paid social. Budget allocation should reflect that difference.
Identify your LTV prediction window
At what point in the customer lifecycle does your model need to make a prediction? For most DTC brands, day 7 behavioral signals contain enough information to generate a meaningful pLTV score. Waiting for a second purchase means waiting 30 to 90 days. That delay is the latency problem pLTV is built to eliminate.
Connect the LTV score to your bidding layer with sub-24-hour latency
A pLTV score that sits in a warehouse and exports weekly does not improve acquisition economics in real time. The score needs to reach your bidding layer within hours of being generated. This requires server-to-server integration with Google's Conversion API or Meta's CAPI, not a CSV upload workflow.
What Good LTV:CAC Looks Like in Practice
First Page Sage benchmarks suggest a 3:1 LTV:CAC ratio as the baseline for a healthy DTC acquisition program. A 4:1 to 5:1 ratio indicates a well-performing program with pricing power to invest more aggressively in acquisition. Below 2:1 is structurally unsustainable at scale. The calculation at the campaign level is straightforward: if your 12-month cohort LTV for Google-acquired customers is $204 and your blended CAC from Google is $68, your LTV:CAC is 3.0x. If pLTV bidding improves average cohort LTV by $40 per acquired customer by filtering toward higher-quality profiles, the ratio moves to 3.6x without touching acquisition spend.
That 3.6x ratio is not just a better reporting number. It is the economic signal that justifies increasing acquisition investment. A brand with a 3.6x LTV:CAC and confidence in the model has headroom to bid more aggressively for the high-value customer profile, because the unit economics support a higher acquisition price. This is the mechanism through which pLTV bidding turns signal quality improvement into scalable growth: better customer selection at acquisition produces a higher LTV:CAC ratio, which expands the range of viable bid prices, which allows the brand to outcompete on the customers that actually matter.
| LTV:CAC Ratio | Interpretation | Acquisition Decision |
|---|---|---|
| Below 1.5x | Unit economics unsustainable at current CAC | Stop scaling. Fix signal quality first. |
| 1.5x to 2.5x | Marginal - survives but does not compound | Hold spend. Prioritize LTV model training. |
| 2.5x to 3.5x | Healthy baseline for sustained investment | Scale cautiously with pLTV signal active. |
| 3.5x to 5.0x | Strong - headroom to bid more aggressively | Scale. Raise bids for top-tier LTV profiles. |
| Above 5.0x | High-performing program or underinvesting | Likely underinvesting in acquisition. Increase budget. |
Key Takeaways
- CAC is a cost metric. It tells you what you spent per acquisition. It does not tell you whether those customers were worth the price. LTV:CAC is the ratio that governs whether a paid acquisition program is compounding or bleeding.
- CAC has risen 222% over eight years. The brands absorbing this without margin collapse are measuring LTV:CAC by channel, not just blended CAC, and reallocating budget based on which channels produce sustainable ratios.
- The typical DTC brand retains only 28.2% of customers for a second purchase. That single number determines whether your current acquisition program is an investment or an expense.
- LTV:CAC becomes a bidding signal, not a lagging metric, when pLTV scores from a trained ML model are connected to Google and Meta bidding layers in real time. Below 3:1, you should be improving signal quality before scaling spend. Above 3.5:1, you have economic headroom to bid more aggressively for high-value profiles.
- Real-time activation means the pLTV score influences the bid before the acquisition happens. A weekly CSV export is not real-time activation. Sub-24-hour server-to-server integration is.
Related Reading
For the mechanics of how a pLTV model is built and the five features that predict high-value customers most reliably, see What Is Predictive Customer Lifetime Value (pLTV) and Why Every Growth Team Should Care. For the Google Ads implementation of real-time LTV activation with tROAS recalibration, see pLTV Bidding on Google Ads: A Step-by-Step Guide for DTC and eCommerce Brands.