The Budget You Think Is Working
Your paid acquisition dashboard shows improving ROAS. Your CAC held flat last quarter. Your board deck has the right numbers on it. None of this tells you whether the customers you acquired will ever come back.
The average DTC brand allocates 15 to 40% of its paid acquisition budget to customers who make one purchase and never return. As customer acquisition costs have risen 222% over eight years, the financial consequence of that misallocation has compounded. Understanding why CAC without LTV is a vanity metric is the first step toward recovering that budget.
This is not a media buying problem. It is a signal quality problem. The optimization target you provide to Google and Meta at the moment of the auction determines which customer profile the algorithm learns to find. When that target is first-order checkout value, the algorithm learns to find one-time buyers efficiently. It becomes very good at exactly the wrong thing.
Who This Paper Is For
This paper is written for founders and CMOs of DTC ecommerce brands spending $50,000 or more per month on paid acquisition across Google and Meta. If your repeat purchase rate is below 35%, or if you have never run a revenue concentration analysis on your acquired cohorts, the mechanism described here is operating in your business right now.
Budget Allocation by Customer LTV Outcome
15-40% of paid acquisition budget goes to single-purchase churners who generate the same conversion signal as high-LTV repeat buyers. The top 15% by LTV drives 53% of total revenue.
Why First-Order Optimization Is Structurally Broken
Every major ad platform runs a second-price auction where bids are determined by predicted conversion probability multiplied by conversion value. Google's Performance Max and Smart Bidding systems and Meta's Advantage+ campaigns both operate this way. By default, the conversion value in both systems is your historical average order value within the attribution window.
By default, the conversion value in both systems is your historical average order value within the attribution window. For most DTC brands, that is a 7-day click or 1-day view window. It captures the transaction amount. It captures nothing about whether that customer will repurchase, expand their product usage, or generate profitable 12-month revenue. This signal gap is precisely what signal engineering addresses - replacing the algorithm's default visibility ceiling with first-party behavioral features that predict 12-month customer value.
The Algorithm Learns What You Teach It
When you run tROAS on Google or Value Optimization on Meta with AOV as your conversion value, you are teaching the algorithm one thing: find people who are likely to make a first purchase at the average price point. The algorithm executes this objective with exceptional precision. It becomes better at it every week as more conversion data accumulates.
The customers it learns to find are statistically optimized for first-order conversion behavior. They are not optimized for retention, repurchase frequency, or LTV. A customer with a 3% probability of repurchasing within 90 days and a customer with a 61% repurchase probability look identical to the algorithm if their first-order AOV is the same.
The result is a bidding system that compounds toward unprofitability over time. As the algorithm improves at finding one-time buyers, it improves at finding them at progressively higher CPMs, because the most efficient first-order converters are also the most contested audience segments.
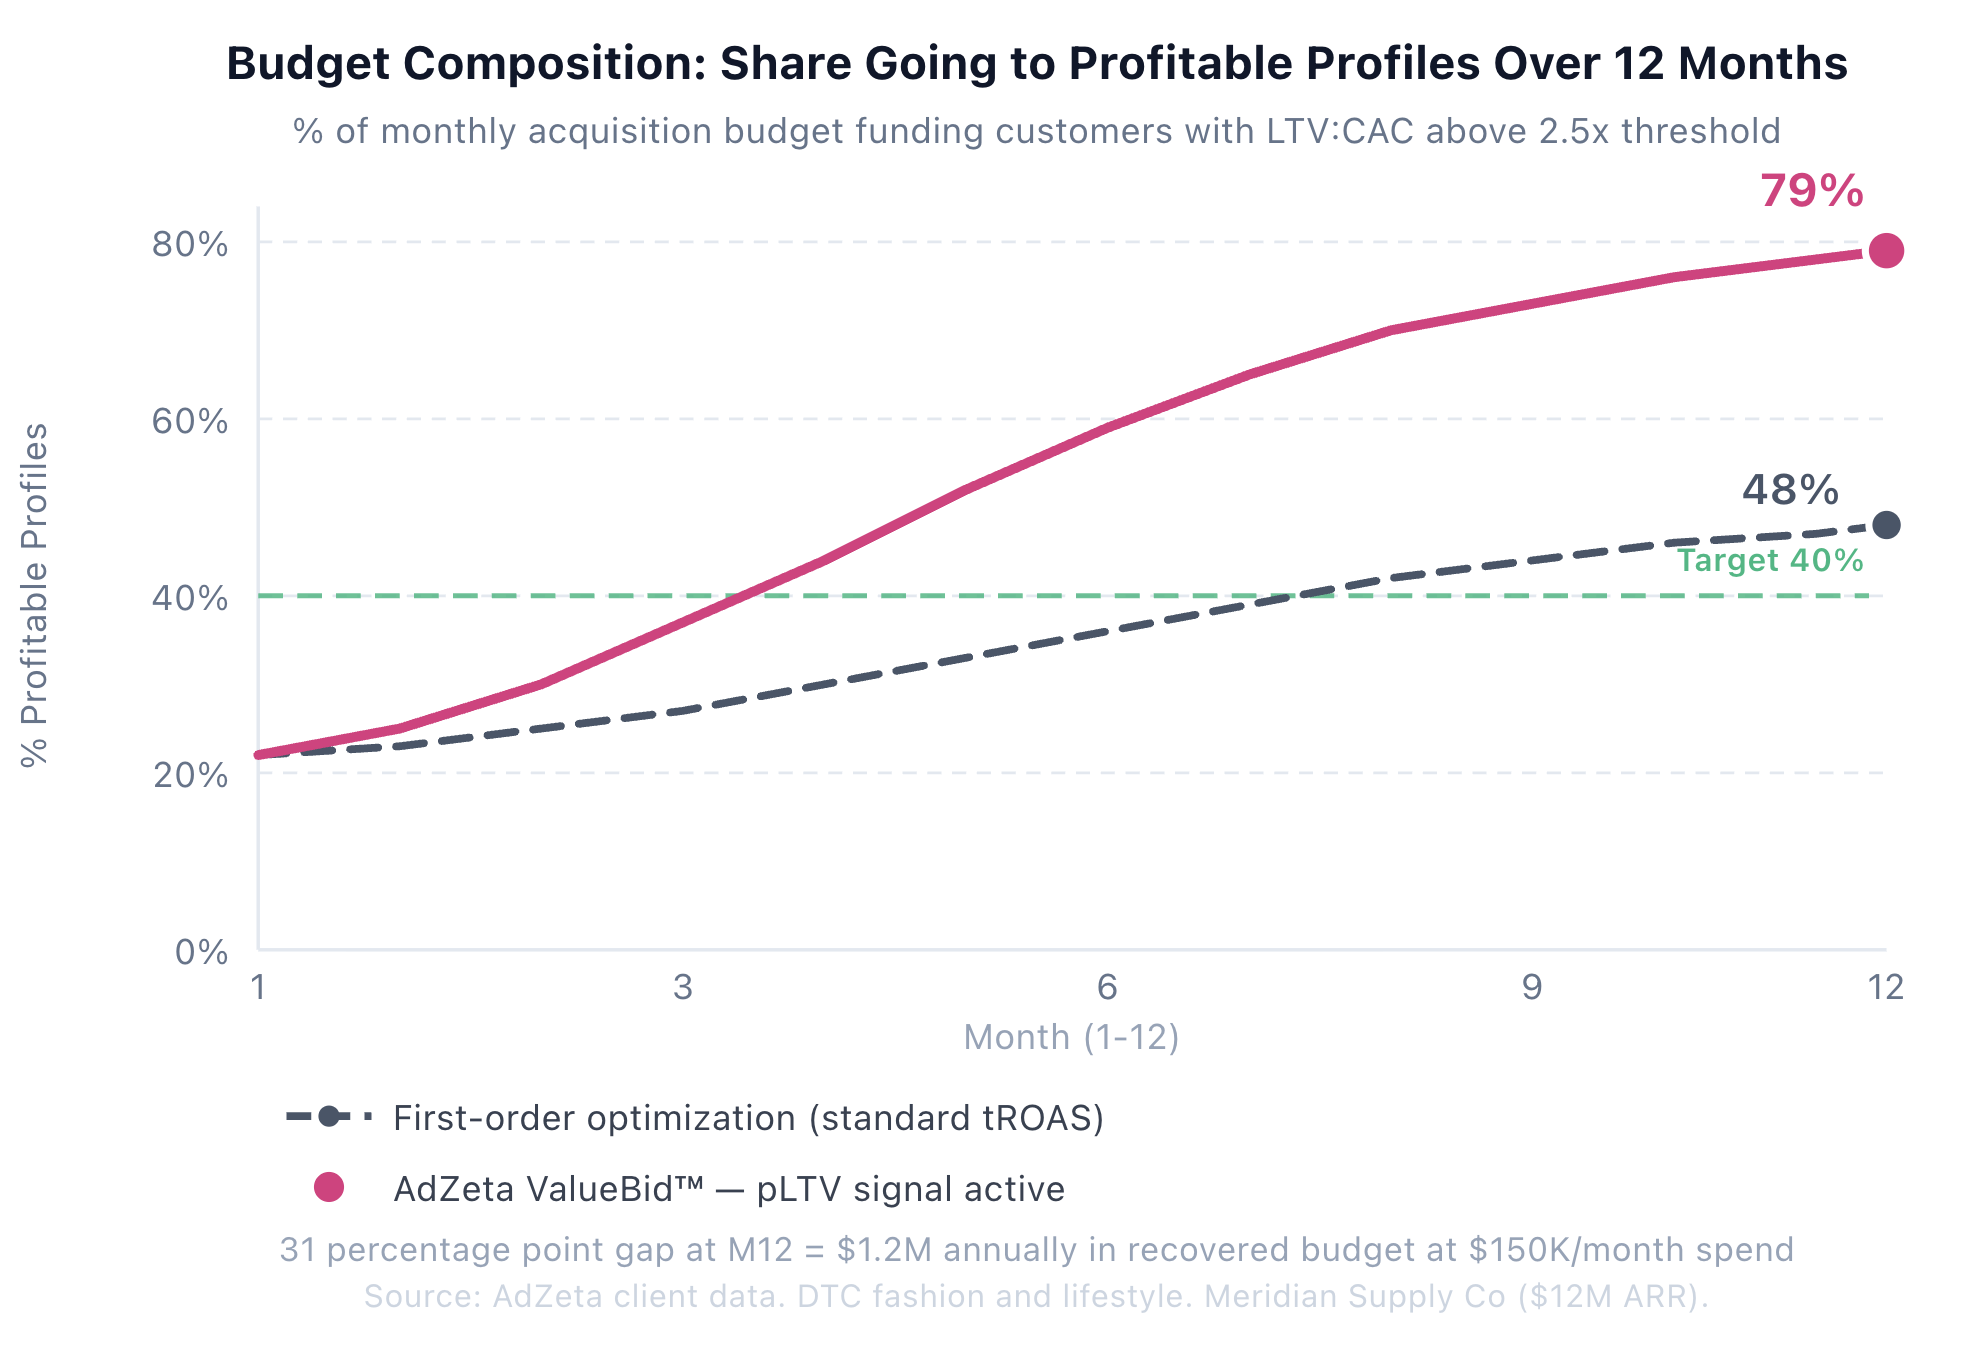
Key Takeaway: The algorithm optimizes for the signal you provide. When you provide first-order checkout value, it finds first-order buyers. When you provide predicted 12-month LTV, it finds customers who will generate 12-month revenue. These are different people discoverable through different behavioral signals.
Feature Importance: Default Bidding Signals vs LTV Predictors
Checkout AOV (0.85 importance) dominates what the algorithm sees by default. Time-to-second-purchase (0.93) and category breadth (0.82) are the highest predictors of 12-month LTV and are invisible to the algorithm unless explicitly sent.
What Actually Predicts a Profitable Customer
Revenue concentration analysis across 50+ DTC brands in AdZeta's client base reveals five signals that consistently predict high-LTV customers. These are the features that predictive LTV models use to score each incoming customer - none of them are visible to Google or Meta by default. Harvard Business Review research confirms that acquiring and retaining the right customers, rather than the most customers, is the primary lever in profitable growth.
Time to second purchase is the strongest single predictor, with a feature importance score of 0.93 in LTV models. Customers who repurchase within 30 days show 3x the 12-month LTV of those who do not. Most brands track repurchase rate as a percentage. Very few track the speed distribution, which is the predictive signal.
Product category breadth in the first 60 days carries a 0.82 importance score. Customers who cross into a second product category early in their lifecycle are structurally different retention profiles from single-category buyers. This signal is calculable from basic order line item data.
AOV direction from order one to order two matters more than the absolute AOV amount. Customers whose order value increases from first to second purchase show significantly higher predicted LTV than those who stay flat or decline.
Lifecycle email engagement before the second purchase provides leading intent signal before a second transaction exists to measure. Open and click-through rates on product recommendation emails in the 7-30 day post-purchase window are a high-quality LTV predictor.
Acquisition channel carries predictive weight for up to 24 months. Organic search and branded paid search customers behave differently from unbranded paid social customers at month 18, not just month one. The acquisition source is a durable signal.
First-Order Optimization vs pLTV Bidding
| Dimension | First-Order Optimization | pLTV Bidding (AdZeta) |
|---|---|---|
| Optimization signal | First-order AOV (7-day window) | Predicted 12-month LTV (day 7 model) |
| Who the algorithm finds | Efficient first-order converters | High-LTV repeat buyer profiles |
| Budget allocation | Uniform across all converted profiles | Tiered by predicted 12-month value |
| What improves over time | First-order conversion efficiency | LTV:CAC ratio and cohort revenue quality |
| Repeat purchase rate | No influence | Directly optimized by subscriber signals |
| ROAS after 12 months | Compresses as CPMs rise | Improves as model learns and compounds |
The AdZeta ValueBid™ Approach: Replacing First-Order Signal at the Auction
AdZeta's ValueBid™ framework replaces the first-order checkout value in your Google Ads and Meta Conversions API bid calculations with a predicted 12-month customer LTV score. The full technical implementation for Google is covered in pLTV Bidding on Google Ads: Step-by-Step Guide and for Meta in LTV-Based Bidding on Meta Ads: What Actually Works in 2026.
The model reaches 85%+ prediction accuracy by day 7 of a customer's lifecycle, using the five feature categories described above. It does not require a second purchase to generate a score. It uses early behavioral signals, including browsing depth, email engagement timing, and first-order category, to predict where the customer will fall in your revenue distribution. The underlying first-party data activation architecture that makes this possible - connecting your data warehouse to Google's Offline Conversion Import and Meta's CAPI - is handled by AdZeta's integrations layer.
What Changes in the Auction
When Google's tROAS system receives a pLTV score of $412 as the conversion value instead of an $84 AOV, it recalibrates its bid calculation proportionally. The algorithm now bids to acquire profiles that predict $412 in revenue, not profiles that transact at $84. Over time, as the algorithm accumulates training data on which profiles actually produce high pLTV outcomes, its predictive accuracy on your specific customer base improves.
The same mechanism operates on Meta. Andromeda receives the pLTV score as the conversion value via CAPI. Its training shifts from first-order buyer profiles to the behavioral characteristics associated with high predicted LTV in your customer base.
From First-Party Data to Real-Time Bid Activation
AdZeta's ValueBid™ pipeline replaces first-order AOV with predicted 12-month LTV at every auction point across Google, Meta, and programmatic DSPs.
No comparison data available
Meridian Supply Co: DTC Fashion and Lifestyle
Fashion and Lifestyle DTC ($12M ARR)Meridian was spending $150,000 per month across Google Shopping, Performance Max, and Meta. Blended ROAS held at 3.8x but 90-day cohort analysis showed 38% of acquired customers making a single purchase and never returning. Revenue concentration showed the top 17% of customers by LTV generating 51% of total 12-month revenue. The bottom 31% produced negative acquisition ROI after factoring in COGS and fulfillment. AdZeta deployed ValueBid™ across all active campaigns. pLTV scores were generated from five features: time-to-second-purchase, product category breadth across accessories and apparel, AOV trajectory from first to second order, lifecycle email engagement with styling content, and acquisition channel classification. Scores pushed to Google via Offline Conversion Import API and to Meta via CAPI in sub-second latency.
Meridian Supply Co: 90-Day Cohort Outcomes Before and After ValueBid™
CAC fell 25%, repeat purchase rate increased 118%, and LTV:CAC improved 79% within 90 days of replacing first-order AOV with pLTV scores in the bidding layer.
Financial Impact at $150K Monthly Acquisition Spend
Revenue Concentration Analysis and Baseline (Days 1-14)
Establish the baseline before any activation. Run a cohort analysis on your last 12 months of acquired customers.
- Pull 12-month cohort data: acquisition date, channel, first-order value, total 90-day revenue
- Calculate repeat purchase rate by acquisition channel (not blended)
- Identify revenue concentration: what percentage of customers generates 50%+ of revenue
- Quantify the budget allocation to non-returners: your actual 15-40% figure
- Document current LTV:CAC by channel as the measurement baseline
pLTV Model Training and Validation (Days 15-30)
AdZeta trains the initial LTV model on your historical cohort data and validates prediction accuracy before activation.
- Connect Shopify or ecommerce platform, CRM, and email tool to AdZeta
- Validate 12+ months of cohort data with known LTV outcomes available for training
- Review initial model accuracy on holdout cohort (target 80%+ rank-order correlation)
- Confirm the five key features are present in your data: time-to-repurchase, category breadth, AOV direction, email engagement, channel
- Review pLTV score distribution across current active customer base
Bid Activation and Measurement (Days 31-90)
Activate pLTV scores across Google and Meta. Measure against the cohort quality metrics established in Phase 1.
- Configure Offline Conversion Import or Data Manager API for Google with pLTV as conversion value
- Configure Meta CAPI with pLTV score as conversion value and full identifier set for EMQ 9-10
- Set tROAS 15-20% below historical during algorithm learning period (weeks 1-3)
- Run Google Ads Campaign Experiment to isolate pLTV arm (50/50 traffic split)
- Measure at day 90: repeat purchase rate in acquired cohort vs baseline, LTV:CAC vs baseline
Start with a Revenue Concentration Analysis
Before changing any campaign settings, run a cohort analysis on your last 12 months of acquired customers. Calculate what percentage of your acquisition budget funded customers who made one purchase and never returned. That number is your baseline. It is also the number that makes the ROI case for pLTV activation without any vendor involvement.
Measure Repeat Purchase Rate by Channel, Not Blended
Blended repeat purchase rate conceals the variance between channels. In most DTC brands, the best and worst channels on a repeat purchase basis differ by 2 to 3x. The channel with the lowest CAC is rarely the channel with the best cohort quality. Channel-level LTV analysis is the data foundation for every budget allocation decision that follows.
Set the Right Measurement Metric Before Activation
The primary measurement metric for pLTV bidding is repeat purchase rate in the acquired cohort at 90 days, not in-platform ROAS. In-platform ROAS reflects the pLTV scores you injected. Cohort repeat purchase rate proves the model is finding better customers. Agree on this measurement framework before activation begins so the evaluation is based on business outcomes, not platform metrics.
Recovering the Hidden Budget at Your Acquisition Spend
Conservative estimates based on AdZeta DTC client data across 50+ brands
Author
Find Out What Percentage of Your Budget Is Funding Non-Returners
AdZeta's LTV Analyzer runs a revenue concentration analysis on your acquired cohorts in five minutes. You will see your actual 15-40% figure, broken down by channel, with no sales call before you see the numbers.
Run Your Free LTV Analysis